
Figure 3.
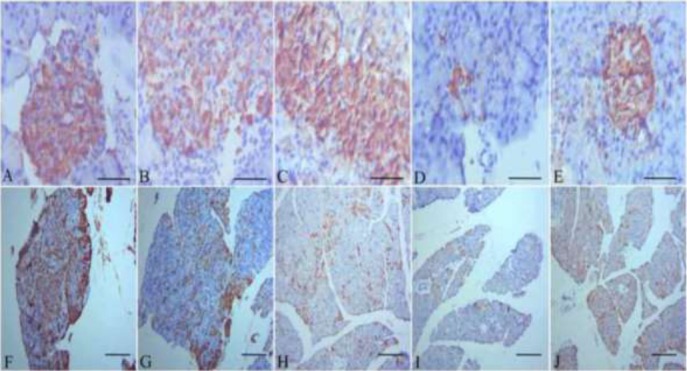
(A): Pancreatic tissue of a healthy control rat showing a normal architecture with normal expression of insulin in the βcells (magnification, x1200). (B): Pancreatic tissue of camel milk administered rat showing normal expression of insulin in the β cells. (C): Pancreatic tissue of metformin administered rat showing normal insulin expression in the β cells. (D): Pancreatic tissue of streptozotocin administered rat showing a reduction in the expression of insulin in the βcells, with atrophy of the βcells (magnification, x1200). (E): Pancreatic tissue of Streptozotocin administered rat treated with camel milk showing the restoration of normal expression of insulin in the pancreatic βcells (magnification, x1200). (F): the pancreas of the healthy control rats presented normal GLUT-4 expression in the pancreatic tissue (magnification, x150). (G): The pancreas of camel milk administered rats showed normal expression of GLUT-4 in the pancreatic tissue (magnification, x150). (H): The pancreas of metformin administered rats presented normal GLUT-4 expression. (I): the pancreatic tissue from the diabetic rats exhibited a reduction in the expression of GLUT-4 (magnification, x150). (J): the pancreas of the diabetic treated with camel milk exhibited restoration of normal expression of GLUT-4 in the pancreatic tissue (magnification, x150). Scale bar for photos from A to E is 50 μm & for photos from F to J is 100 μm.