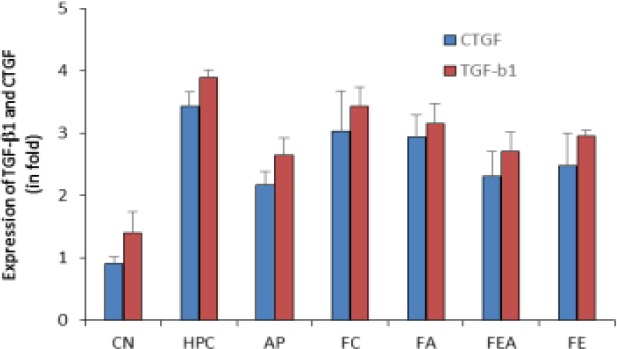
Figure 3.

Comparative TGF-β1 and CTGF levels in control, hyperuricemic and plant extract treated rats. CN control group, HPC- hyperuricemic positive control, group, AP – Allopurinol treated, FC-Chloroform fraction treated, FA-Acetone fraction treated, FEA-Ethyl acetate fraction treated and FE-ethyl alcohol fraction treated. The values are expressed as change in folds of the normal values.
