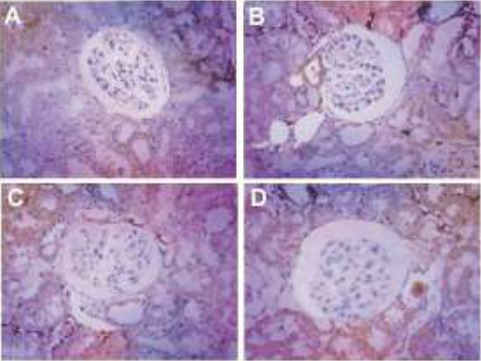
Figure 4.

Representative micrographs indicating attenuated levels of TGF-β1 in hyperuricemic rats. A. Control group, B. Positive control (Hyperuricemic rats), C. Allopurinol treated hyperuricemic rats, D. Hyperuricemic rats treated with primary extract of A. bracteolate
