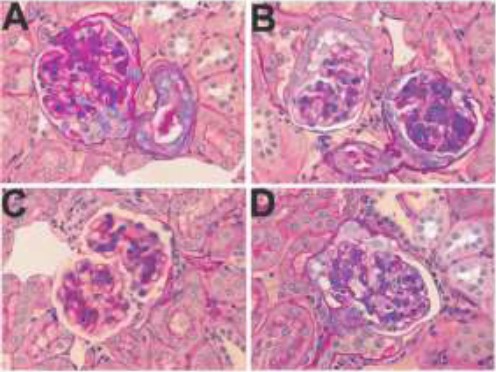
Figure 5.

Representative micrographs indicating attenuated levels of CTGF in hyperuricemic rats. A. Control group, B. Positive control (Hyperuricemic rats), C. Allopurinol treated hyperuricemic rats, D. Hyperuricemic rats treated with primary extract of A. bracteolate
