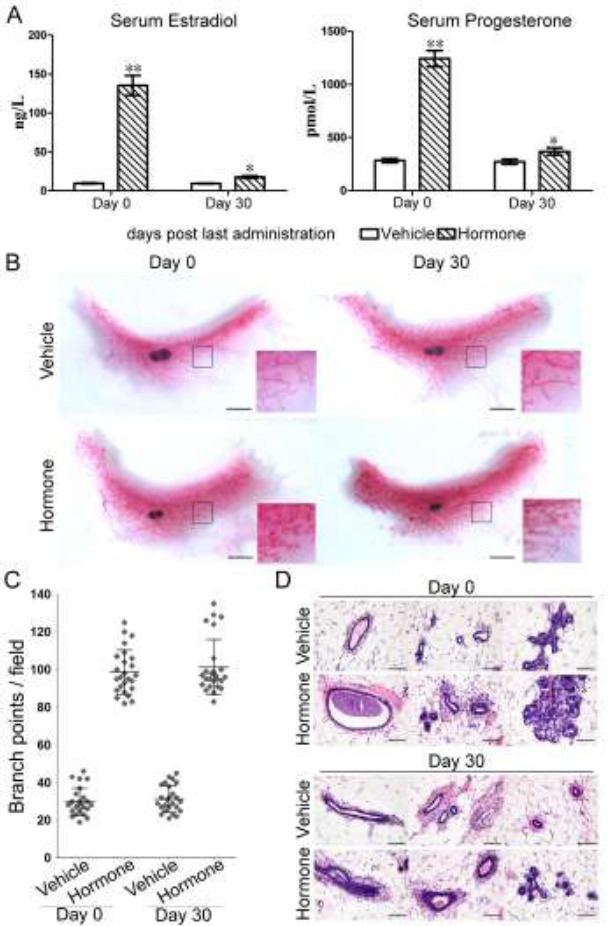
Figure 1.

Mammary hyperplasia induced by estradiol valerate and progesterone. A. Serum levels of estradiol and progesterone were measured by Elisa on Day 0 and Day 30 after the last administration. Comparison was made between hormone-treated group and vehicle-treated group. **, p<0.001; *, p<0.05 (n=10). B. Whole mount staining was preformed to detect the morphological changes after hormone treatment. Representative samples were shown. Scale bar: 0.5 cm. C. The number of branch points was quantified under microscope. One dot represents the number of branch points in one field. (n=5). D. HE staining was applied to observe the histological changes inside the mammary gland. Scale bar: 50 micrometer.
