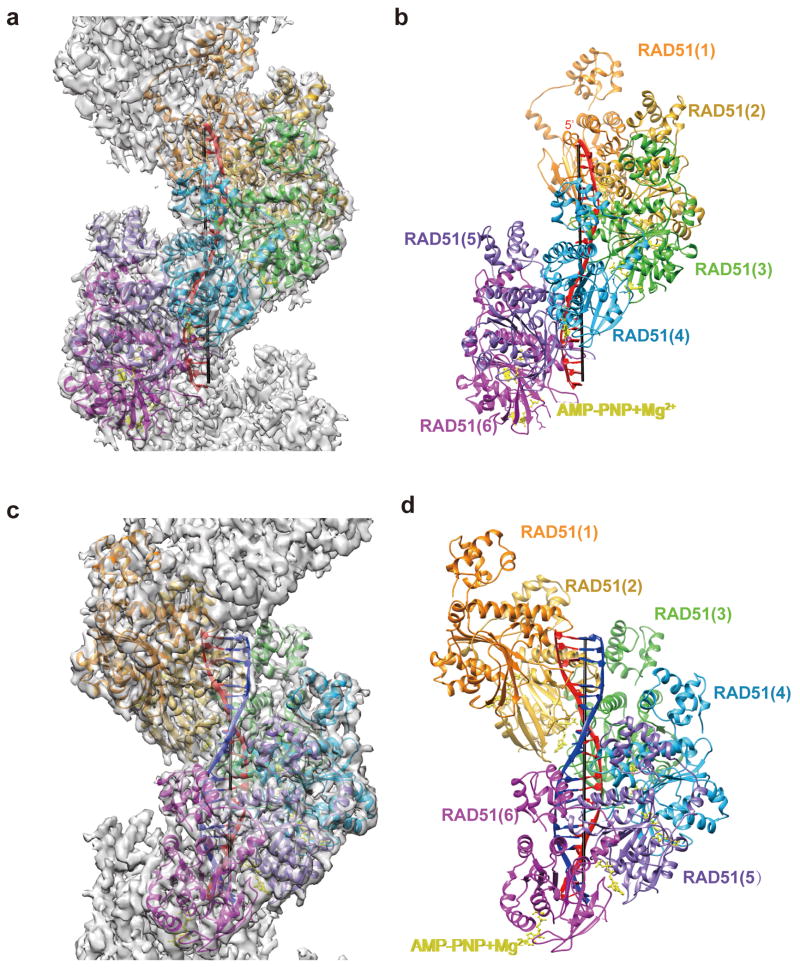
Figure 1. Structures of RAD51 presynaptic and post-synaptic complexes.
(a) Cryo-EM density map superimposed with the (b) atomic model of the presynaptic complex. (c) Cryo-EM density map superimposed with the (d) atomic model of the post-synaptic complex. The invading ssDNA is in red and the complementary strand from the homologous dsDNA is in blue. RAD51 protomers are in orange, golden, lime green, cyan, medium purple, magenta as the order and AMP-PNP-Mg2+ is in yellow.

