
Figure 1. Graphical representation of mean left ventricular (LV) twist mechanics at baseline and during post‐exercise ischaemia and β1‐AR blockade (bisoprolol).
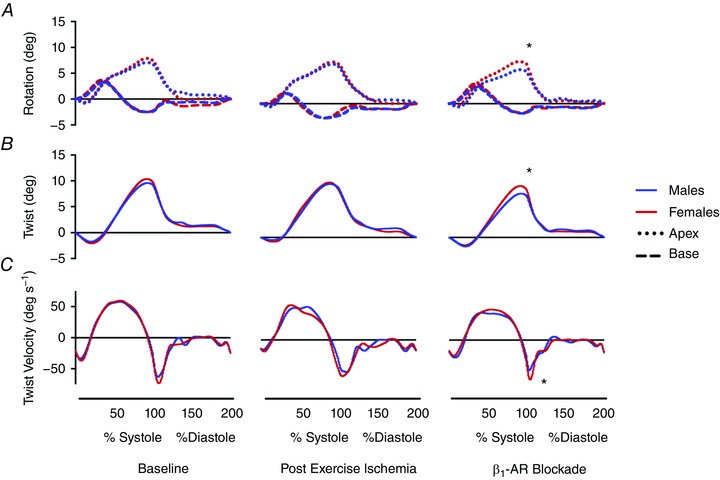
Blue and red lines represent mean data for males and females, respectively. A, dotted and dashed lines represent rotations of the LV apex and base, respectively. B, continuous lines represent LV twist. C, continuous lines represent twist and untwisting velocities. SD values are provided in Table 3. * P < 0.05 males vs. females. [Color figure can be viewed at wileyonlinelibrary.com]