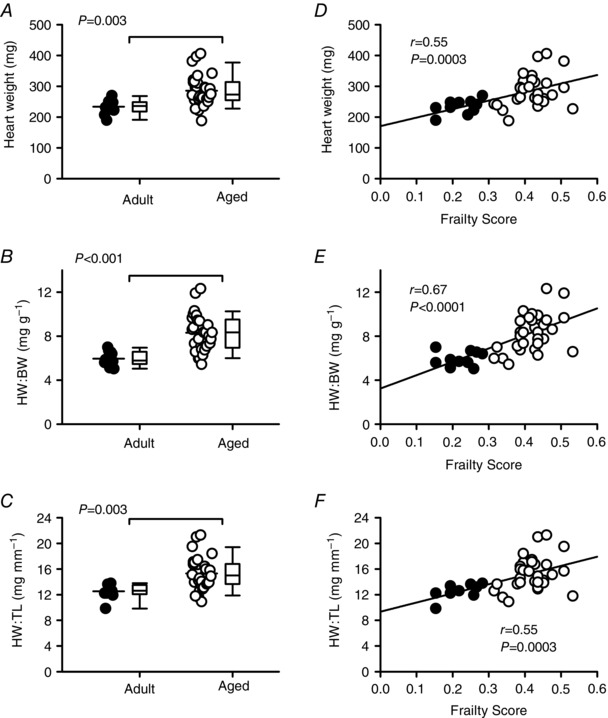
Figure 2. Cardiac hypertrophy increases with age and is directly proportional to FI scores.

A–C, mean HW, HW:BW and HW:TL ratios were higher in aged mice compared to adult mice (P < 0.003 for all). D–F, scatterplots show that FI scores are positively correlated with HW, HW:BW and HW:TL ratios (n = 10 adult and 30 aged mice). Differences between age groups were assessed with a t test or Mann–Whitney Rank Sum test; correlations were evaluated with linear regression analysis. HW = heart weight; HW:BW = heart weight to body weight ratio; HW:TL = heart weight to tibia length ratio. Filled symbols indicate adult mice and open symbols indicate aged mice.
