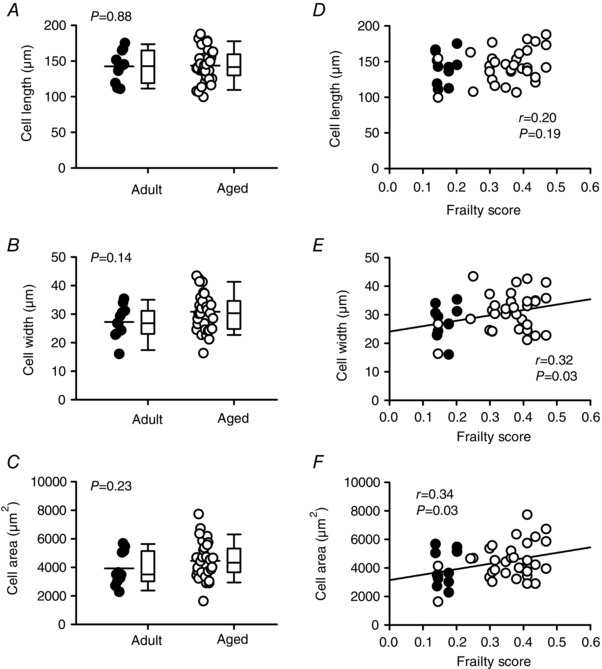
Figure 3. Myocyte hypertrophy, characterized by larger cell widths and areas, increases as FI scores increase.

A–C, scatterplots and box and whisker plots indicate that cell length, width and area were not affected by age. D, cell length was not correlated with FI scores. E–F, scatterplots show that cell width and area were positively correlated with frailty (n = 11 adult and 32 aged myocytes). Differences between age groups were assessed with a t test; the relationship between FI and indices of hypertrophy were evaluated with linear regression. Filled symbols indicate adult mice and open symbols indicate aged mice.
