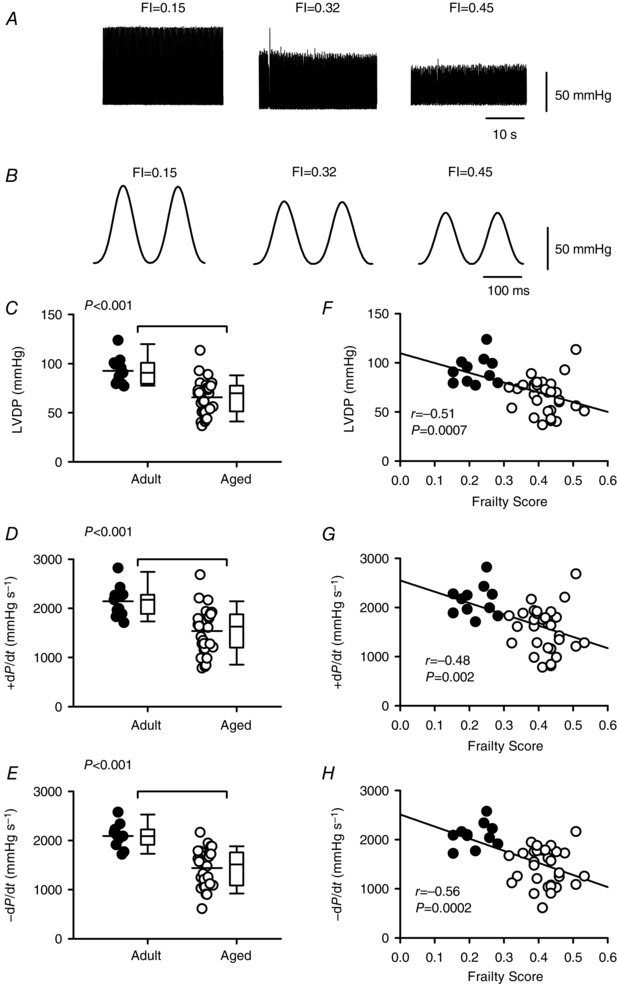
Figure 4. Left ventricular contractile function declines with age and is graded by frailty.

A, representative examples of pressure recorded from perfused hearts isolated from mice with different FI scores. B, pressure recordings illustrated in A shown at an expanded time scale to illustrate differences in +dP/dt and –dP/dt. C–E, scatterplots plus box and whisker plots demonstrate that LVDP, +dP/dt and –dP/dt decreased with age. F–H, regression lines show that LVDP, +dP/dt and –dP/dt were graded by FI score and declined as frailty increased (n = 11 adult and 30 aged mice). Differences between age groups were assessed with either a t test or a Mann–Whitney Rank Sum test; correlations were performed with linear regression analysis. Filled symbols indicate adult mice and open symbols indicate aged mice.
