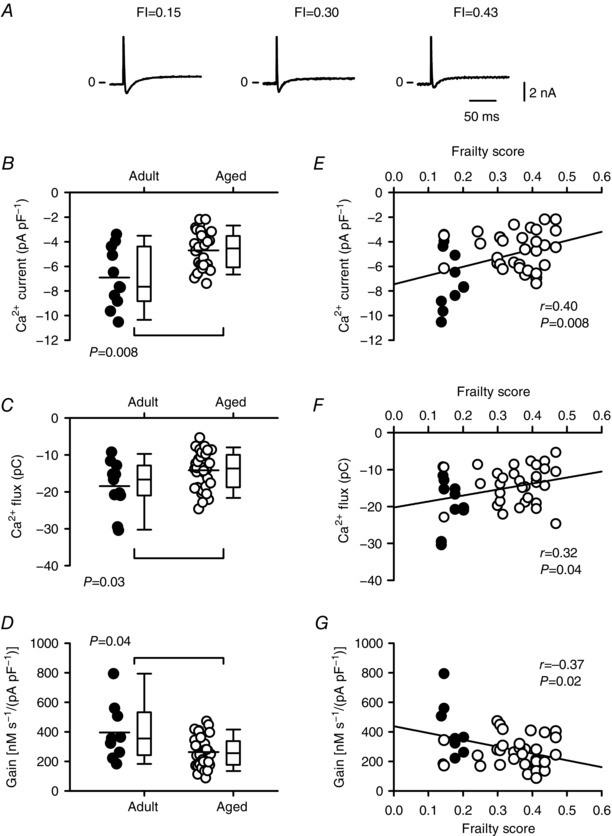
Figure 8. Frailty grades the age‐dependent reduction in peak Ca2+ current, Ca2+ flux and the gain of SR Ca2+ release in voltage‐clamped myocytes.

A, representative Ca2+ currents recorded from cells from mice with different FI scores. B and C, peak Ca2+ current and the integral of the Ca2+ current (Ca2+ flux) declined with age. D, the gain of SR Ca2+ release decreased with age. E and F, the age‐related declines in peak Ca2+ current and Ca2+ flux were graded by FI score. G, the gain of SR Ca2+ release was negatively correlated with frailty score. Differences between age groups were assessed using a Mann–Whitney Rank Sum test and correlations were evaluated with linear regression analysis (n = 11 adult and 32 aged myocytes). Filled symbols indicate adult mice and open symbols indicate aged mice.
