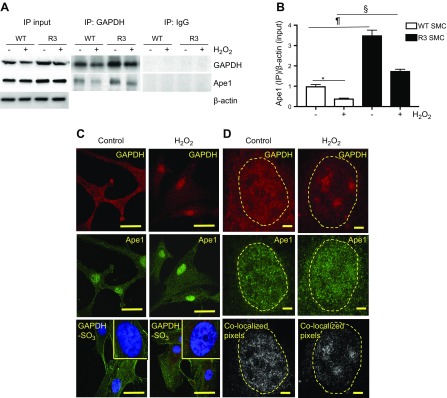
Figure 3.
GAPDH bound Ape1 in the SMC nucleus, and treatment with H2O2 disrupted nuclear GAPDH/Ape1 complex. A, B) WT and R3 SMCs were grown to confluence and treated with H2O2. A) For immunoprecipitation (IP), total cell lysate was incubated with rabbit GAPDH Ab or with rabbit IgG (control), and immunoprecipitate was immunoblotted with GAPDH and Ape1 Ab. B) Quantitative densitometry data show the Ape1 amount in GAPDH immunoprecipitate (n = 3). *P < 0.05, ¶P < 0.01, §P < 0.005. C, D) Conventional confocal (C) and gSTED super-resolution (D) microscopy. SMCs were incubated with or without 110 μM H2O2 for 6 h, fixed in methanol, permeabilized with 0.5% Triton X-100, and incubated with GAPDH (red) and Ape1 (green) Ab plus DAPI. D) gSTED was performed with a Leica STED microscope equipped with a ×100/1.4 NA oil-immersion plan-apochromatic objective lens. STED images of the nuclear compartment of individual cell without (n = 9) and with H2O2 treatment (n = 13) were used for generation of colocalization pixel map (colocalized pixels shown in white) and for quantification of colocalization coefficients (Pearson’s and Spearman’s) with Fiji software. Dashed line outlines cell nucleus shape. Scale bars: 30 μm (C), 3 μm (D). *P < 0.05 vs. control.

