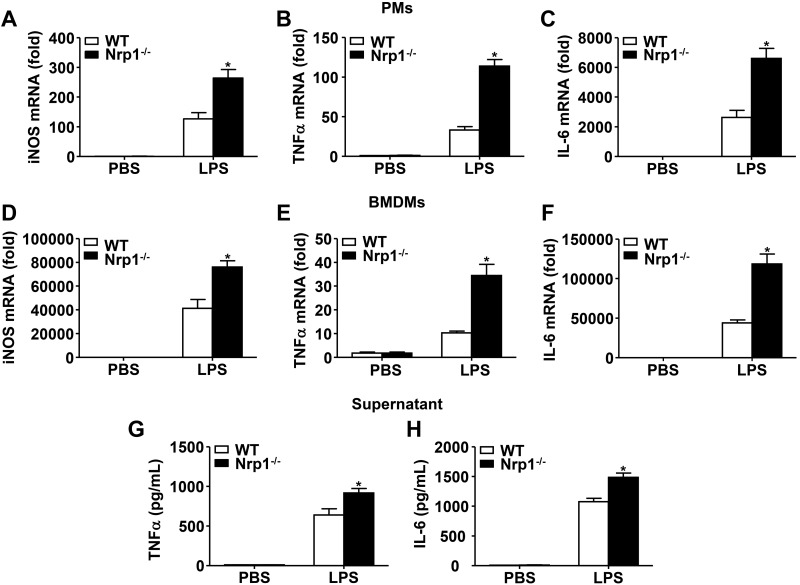
Figure 5.
Nrp1 deficiency exaggerates LPS-induced iNOS, TNF-α, and IL-6 levels in macrophages. A–F) PMs (A–C) or BMDMs (D–F) were unstimulated or stimulated with 100 ng/ml LPS for 4 h. iNOS (A, D), TNF-α (B, E), and IL-6 (C, F) mRNA levels were measured by quantitative RT-PCR. G, H) TNF-α (G) and IL-6 (H) levels in macrophage supernatants were determined by ELISA. Data are expressed as means ± sem. *P < 0.05 vs. WT.

