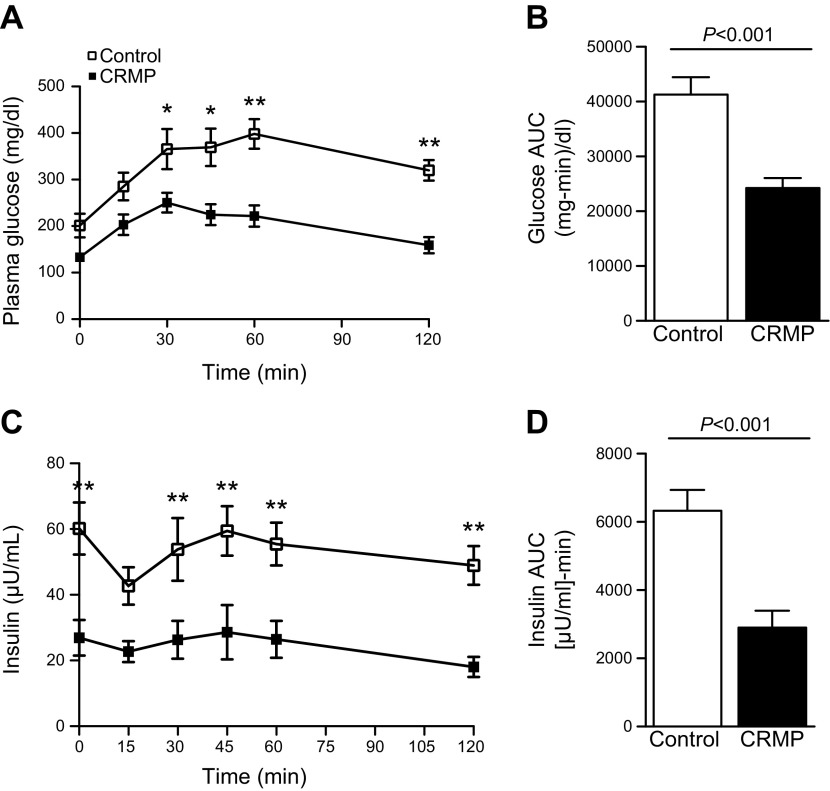
Figure 2.
CRMP improved glucose tolerance and whole-body insulin sensitivity. A, B) Plasma glucose concentrations (A) and area under the curve (AUC) (B) during intraperitoneal glucose tolerance test. C, D) Plasma insulin concentrations (C) and AUC (D) during intraperitoneal glucose tolerance test. Mice were unfed for 6 h before the glucose tolerance test and euglycemic clamp study. Data are means ± sem (n = 7–8 per group). *P < 0.05, **P < 0.01 by 2-tailed, unpaired Student’s t test.

