Figure 3.

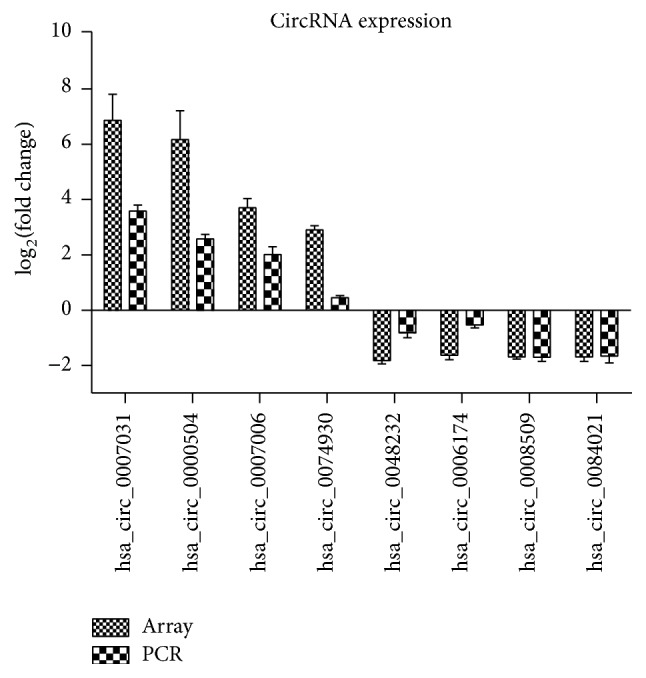
Validation of microarray data by qRT-PCR. Eight differentially expressed circRNAs were validated by qRT-PCR. The heights of the columns in the chart represent the mean expression value of log2 fold changes (CRR HCT116/parental HCT116).

Validation of microarray data by qRT-PCR. Eight differentially expressed circRNAs were validated by qRT-PCR. The heights of the columns in the chart represent the mean expression value of log2 fold changes (CRR HCT116/parental HCT116).