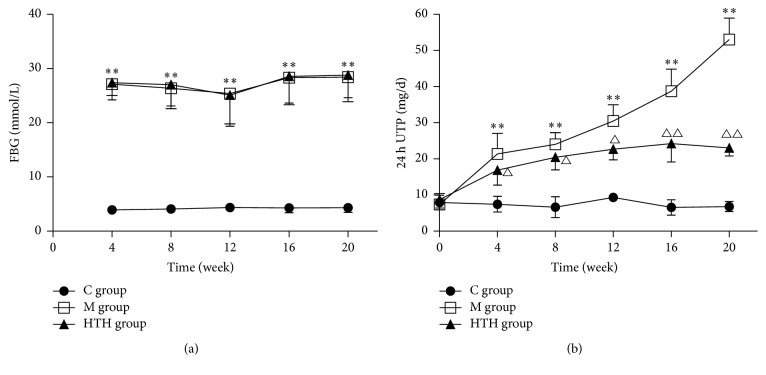
Figure 1.
FBG and 24 h UTP changes of tendency in different groups. The changes of tendency in rats' FBG every 4 weeks. Compared with C group, ∗∗P < 0.01 (a). The changes of tendency in rats' 24 h UTP (24 h urine total protein) every 4 weeks. Compared with C group, ∗∗P < 0.01. Compared with M group, △P < 0.05, △△P < 0.01 (b).

