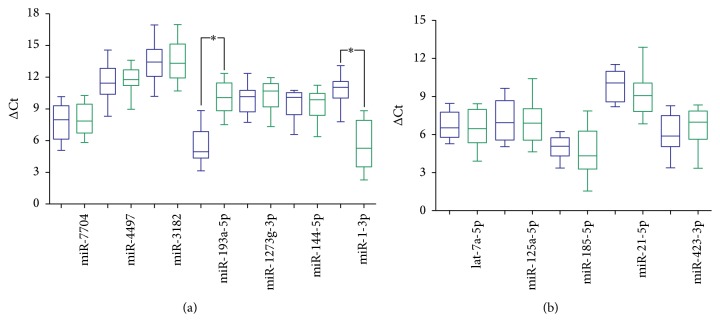
Figure 2.
The quantification results of plasma miRNAs and exosome miRNAs in the healthy samples. (a) The 7 differential miRNAs from sequencing: only 2 miRNAs (miR-193a-5p, miR-1-3p) had significant differences between plasma (blue) and exosome (green) (p value < 0.05). (b) The 5 nondifferential miRNAs: no differences in the qPCR results. The y-axis meant the value of ΔCt = AvgCtmiRNA − AvgCtU6. The asterisk “∗” means the p value is less than 0.05 (<0.05).

