
Figure 2.
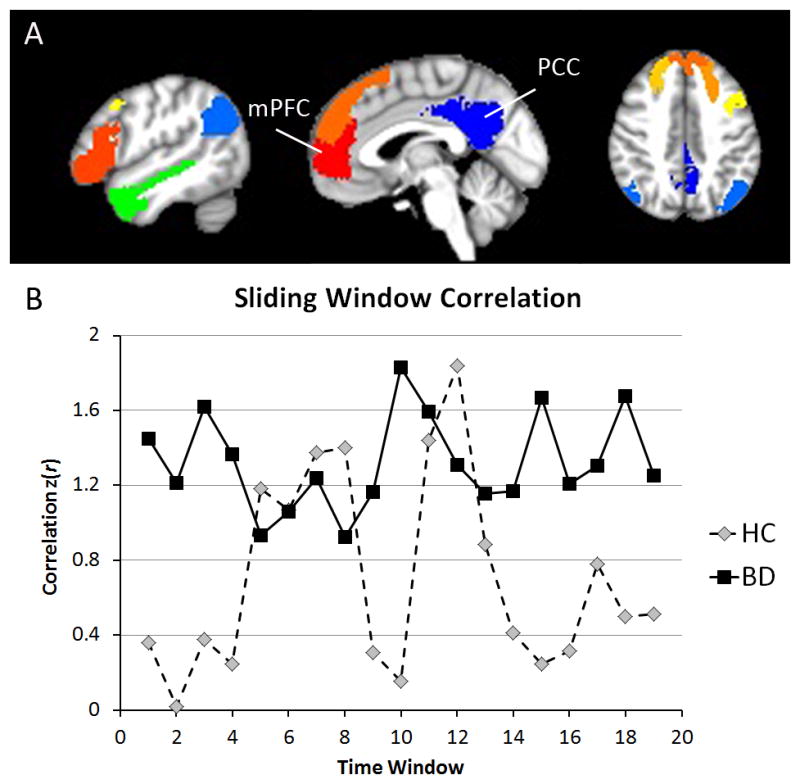
mPFC-PCC connectivity has reduced variability in BD compared to HC but not reduced average correlation strength. (A) Mask locations of the mPFC, PCC, and DMN ROIs. (B) Representative sliding-window correlation time courses between the mPFC and PCC for a HC and BD participant.
BD, bipolar disorder; HC, healthy control; mPFC, medial prefrontal cortex; PCC, posterior cingulate cortex