
Fig. 5.
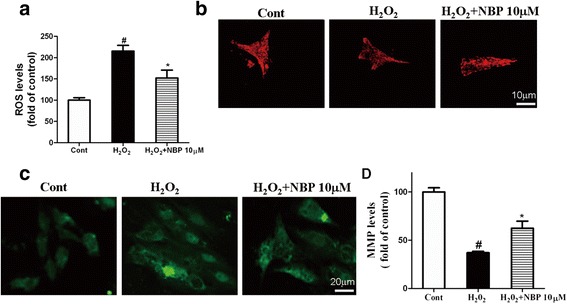
The influence of NBP on mitochondrial function in H9c2 cardiomyoblasts exposed to H2O2. a The generation of ROS in different groups (Control group; H2O2 group; H2O2 + NBP group). b Micrographs of mitochondrial morphology by MitoTracker Red staining in H9c2 (Control group; H2O2 group; H2O2 + NBP group). c Mitochondrial membrane potential (MMP) was determined by evaluation of JC-1 staining under an upright fluorescence microscope after use of the JC-1 assay kit. d Cells were exposed to H2O2 for 2 h and then MMP was determined in the absence or presence of NBP. Results were expressed as the mean ± S.E.M. # P < 0.05 vs Control group; * P < 0.05 vs H2O2 group