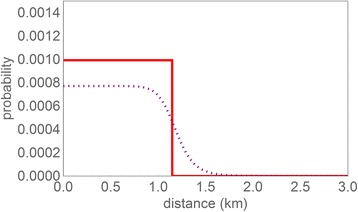
Fig. 2.

Spatial kernel estimated from morbidity data: probability for an individual of experiencing GP-diagnosed pneumonia in 2009 as attributed to an individual poultry farm, as a function of the distance from the individual’s residential location to that of the poultry farm. Red, full line: Maximum-Likelihood estimate (= fitted model). Grey, dotted line: Kernel for the lower confidence bound for the sharpness of the distance dependence and the corresponding profile-likelihood values for the other two parameters
