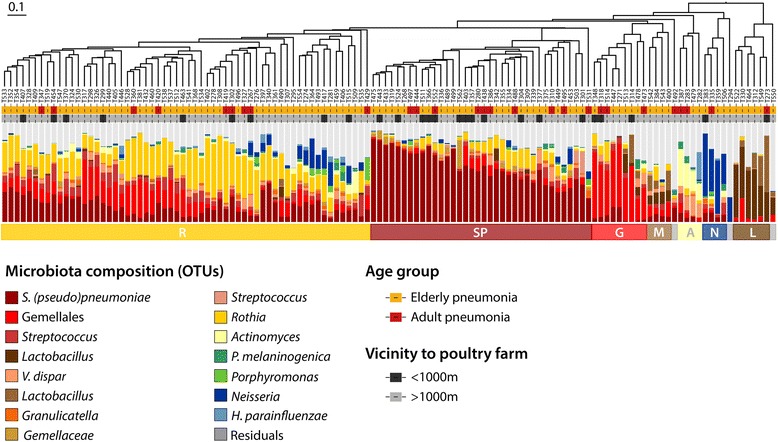
Fig. 4.

Hierarchical clustering of patients based on oropharyngeal microbiome composition. Patients were hierarchically clustered based on their oropharyngeal bacterial communities using the Bray-Curtis dissimilarity measure, which was visualized in the dendrogram. Adjacent to the branches of the dendrogram information on age (yellow; elderly, red; adults) and proximity to poultry farms (dark gray, <1 km; light gray, ≥1 km) is shown. In addition, the relative abundance of the 15 highest ranking operational taxonomic units (OTUs) is shown per patient in vertical stacked bar plots. The colored horizontal bars represent the three major clusters we discerned based on clustering indices which were enriched for Rothia (R), S. pneumoniae (SP) and Gemellales (G). Furthermore, four smaller clusters were observed, distinguished by predominance of Actinomyces (A), Neisseria (N) and Lactobacillus (L). In the fourth cluster no predominance for any OTU was observed (mixed; M)
