
Fig. 1.
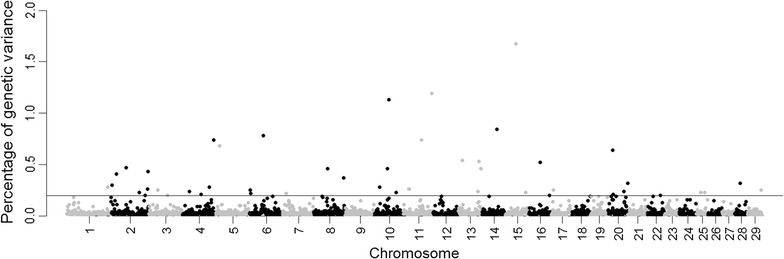
Manhattan plot displaying Bayesian genome-wide association estimates (BayesB, π = 0.99) for tick resistance. The Y-axis represents the proportion of the total genetic variance explained by 1-Mb windows across the bovine genome and the X-axis represents the chromosomal location of windows (2519 non-overlapping windows). Windows explaining more than 0.2% of the genetic variance are above the grey line