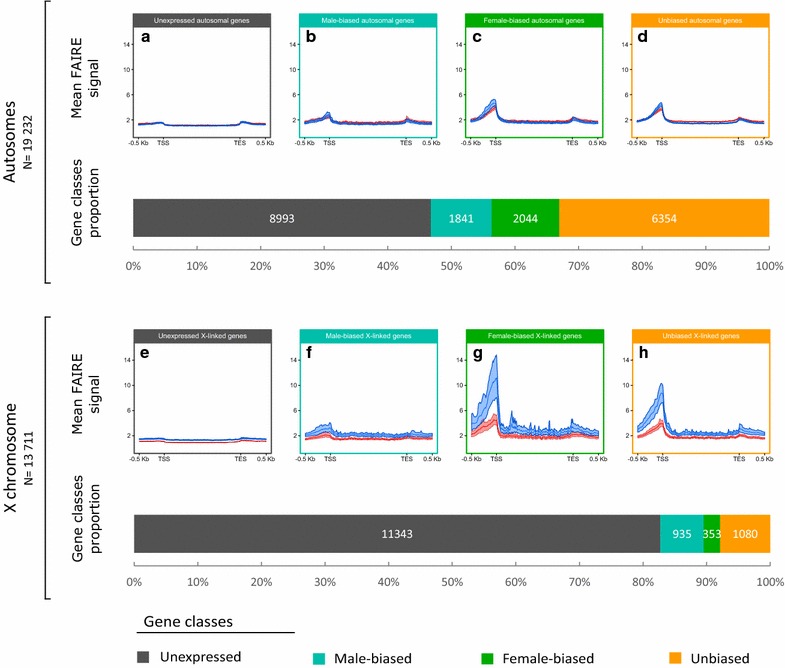
Fig. 7.

Mean FAIRE signal and proportion of X-linked and autosomal genes depending on their expression profile, grouped by chromosome type. Genes have been categorized into four different classes: unexpressed (a, e), male-biased (b, f), female-biased (c, g) and unbiased (d, h) genes between the two sexes based on gene expression data. The mean input normalized FAIRE signal has been calculated around (500 bp) each gene class and in the genes body (scaled) depending on the sex (males in blue and females in red) and on the chromosome type (autosomes, top and X chromosome, bottom). 99% CI based on bootstraps is also shown around the mean. The proportion and the number of the four gene classes are represented for autosomes and for the X chromosome. The same results grouped by sex instead of chromosome type are available as Additional file 4
