Fig. 1.

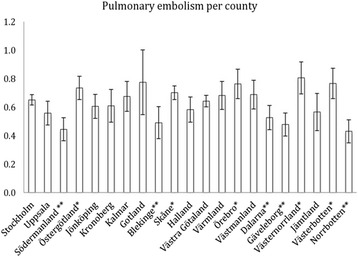
Age-adjusted distribution of PE incidence with 95%CI, divided by county. * = Incidence below the national average. ** = Incidence above the national average

Age-adjusted distribution of PE incidence with 95%CI, divided by county. * = Incidence below the national average. ** = Incidence above the national average