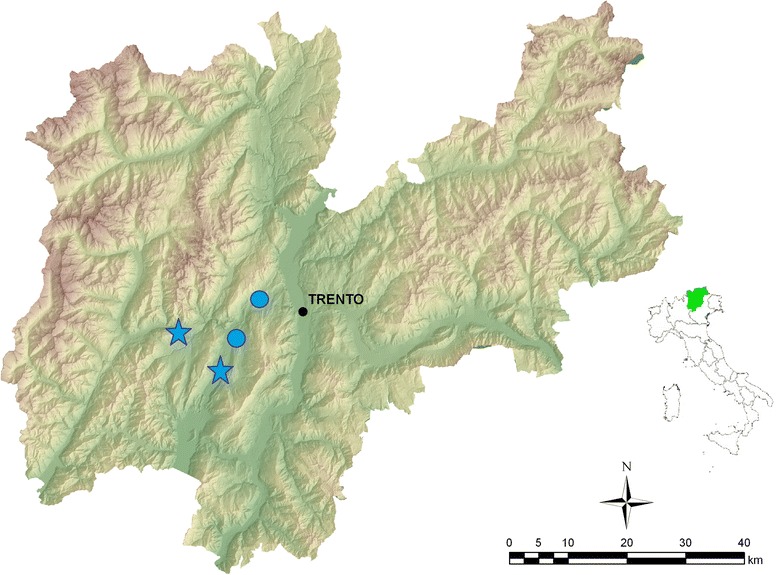
Fig. 2.

Map of the Province of Trento, Italy, showing the position of the rodent sampling sites (stars indicate high altitude sites; circles indicate low altitude sites). Map is a high-resolution digital elevation model (10 m) and land use map both provided by the “P.A.T. S.I.A.T.” service of the Province of Trento
