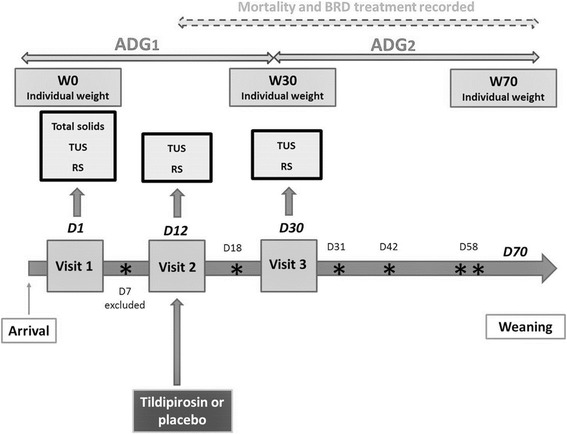
Fig. 1.

Timeframe of the study period with the different data collected and their times of collection as well as calf deaths during the study. Legends. D: Day; W: Weight; TUS: Systematic thoracic ultrasonography; RS: Respiratory score; ADG1: Average daily gain for the first month of feeding; ADG2: Average daily gain for the second month of feeding; (*) represents dead calves; dotted arrow represents the mortality and BRD treatment recorded and integrated in the statistical analysis
