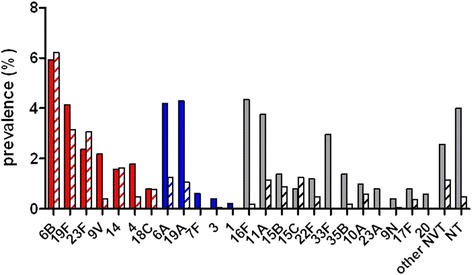
Fig. 1.

Prevalence (% of samples) of pneumococcal serotypes in carriage samples collected from Aboriginal (solid bars) and non-Aboriginal (hashed bars) study participants (1999–2005). 7vPCV serotypes are shown in red, with the additional serotypes contained in 13vPCV shown in blue and non-vaccine types (NVT) shown in grey. NT = non-typeable
