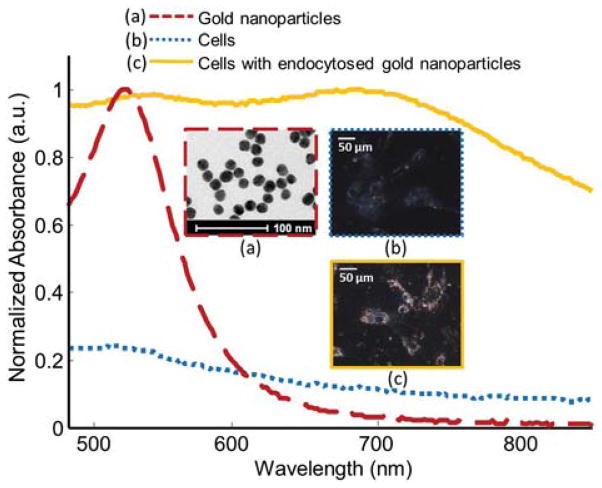
Fig. 2.
(Color online) Normalized absorbance spectra of gold nanoparticles, cells, and endocytosed gold nanoparticles (dashed red, dotted blue, and solid orange lines, respectively). Transmission electron microscopy image of the gold nanoparticles and dark field images of cells with and without nanoparticle loading (dashed red, dotted blue, and solid orange boxes, respectively).

