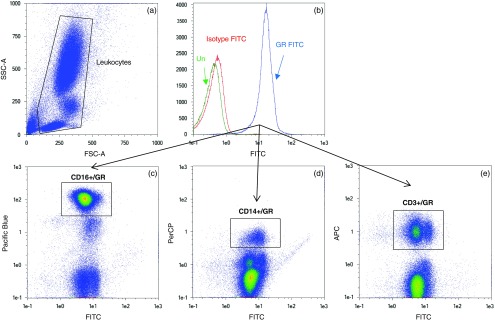
Fig. 1.
Representative flow cytometry plots: glucocorticoid receptor (GR) expression in granulocytes, monocytes, and T lymphocytes was determined by staining with GR FITC, CD16 Pacific Blue, CD14 PerCP, and CD3 APC, respectively, and identifying cells that were positive for both GR FITC and leukocyte subtypes of interest. (a) Forward-scattered (FSC) and side-scattered (SSC) plot of leukocytes; (b) histogram of unstained leukocytes (green), and after staining with IgG isotype-FITC (red) and GR FITC (blue); (c) double-positive signals for granulocytes CD16/GR, (d) monocytes CD14/GR, and (e) T lymphocytes CD3/GR, as identified in rectangular boxes.

