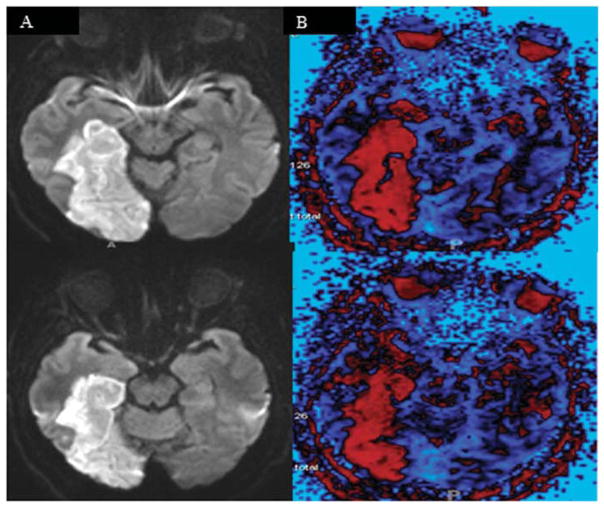
Figure 2. MRI of the Single Patient With an Abnormally Low F0-CV% in the Picture Description Task.
Note. MR Diffusion Weight Image (left) and Perfusion Weight Imaging (right) showing hypoperfusion (in red) in the inferior temporal cortex, including left temporal pole, in a patient with impaired affective prosody expression and production. This figure is oriented according to radiological convention (right hemisphere on the left).

