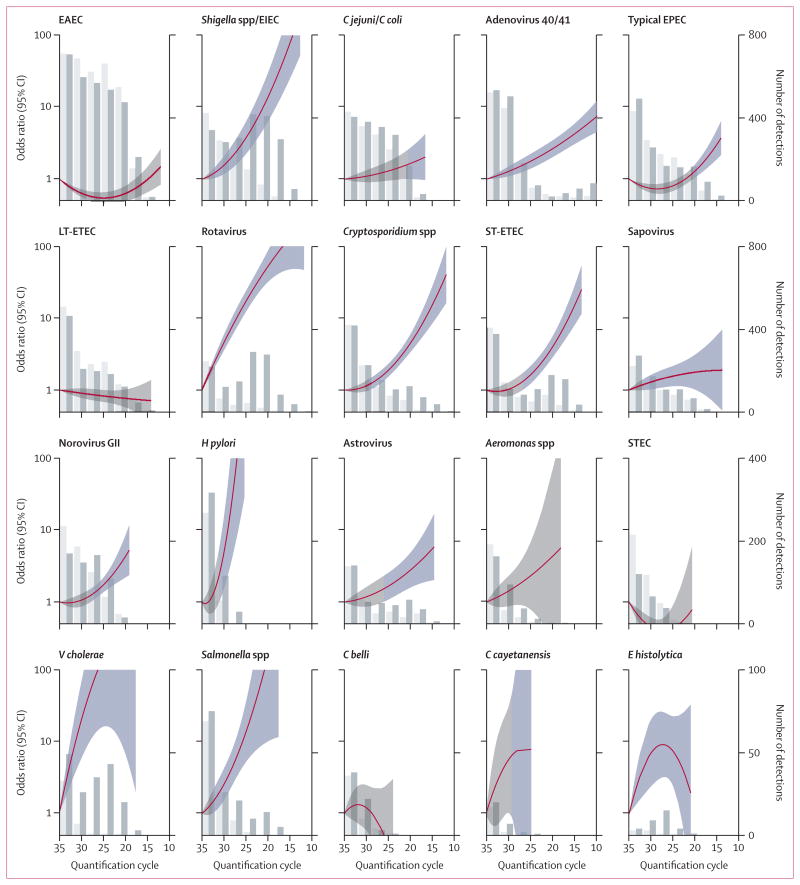
Figure 1. Relation between pathogen quantity and diarrhoea.
Pathogens are ordered from top to bottom and left to right by prevalence in cases. Data are numbers of dectections (vertical bars) in cases (dark grey) and controls (light grey) with odds ratios (red lines) and 95% CIs (bands). The model-derived cutoffs used for identification of diarrhoea-associated pathogens in individuals (overlaid in blue) are defined as all detections above the point at which the 95% CI no longer includes 1. EAEC=enteroaggregative E coli. EIEC=enteroinvasive E coli. EPEC=enteropathogenic E coli. LT-ETEC=heat-labile enterotoxin-producing E coli. ST-ETEC=STh-producing enterotoxigenic E coli. STEC=Shiga toxin producing E coli.

