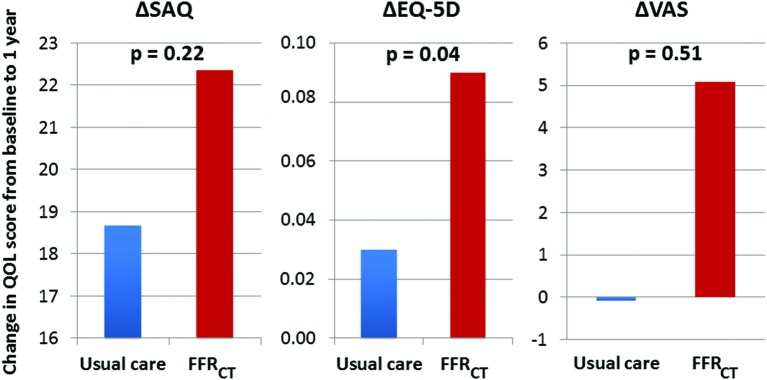
Figure 3.
Change in quality-of-life scores from baseline to 1 year by evaluation strategy. The vertical axes indicate changes in quality of life scores from baseline to 1 year, with a greater improvement seen in the FFRCT cohort compared with the usual care cohort, regardless of the score used. This difference was statistically significant when the EQ-5D score was used. FFRCT=fractional flow reserve estimated using computed tomography, SAQ=Seattle Angina Questionnaire, EQ-5D=EuroQOL, VAS=visual analogue scale for health state.

