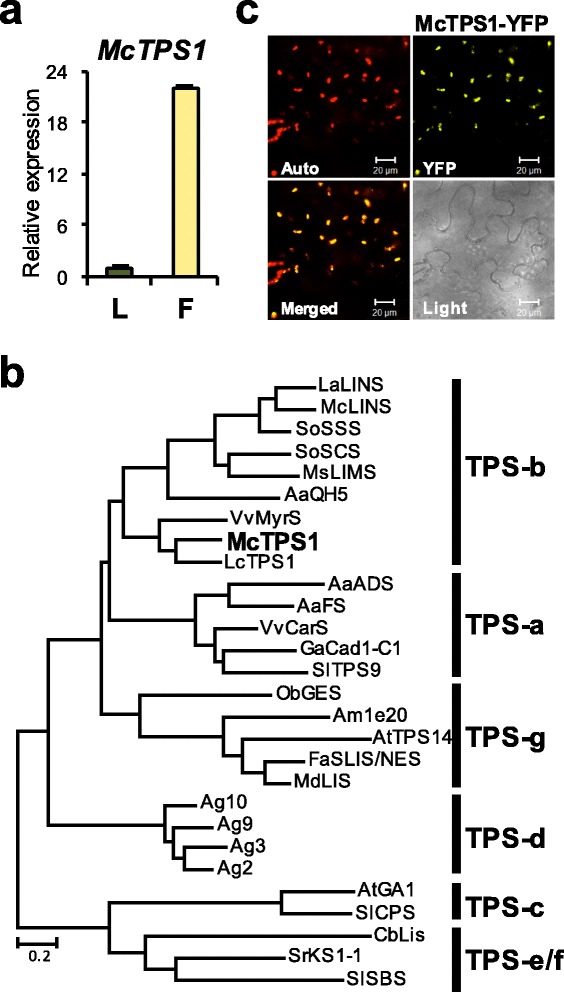
Fig. 6.

Characterization of McTPS1. a Expression of McTPS1 in leaves (L) and flowers (F). b Phylogenetic analysis of McTPS1. A maximum likelihood tree was constructed using amino acid sequences of McTPS1 with other plant TPSs. Accession numbers of proteins used in phylogenetic analysis are listed in Additional file 1: Table S3. c Subcellular localization of McTPS1. Auto, chlorophyll autofluorescence; YFP, YFP channel image; Merged, merged image of Auto and YFP; Light, light microscopy image. Bars, 20 μm
