
Fig. 1.
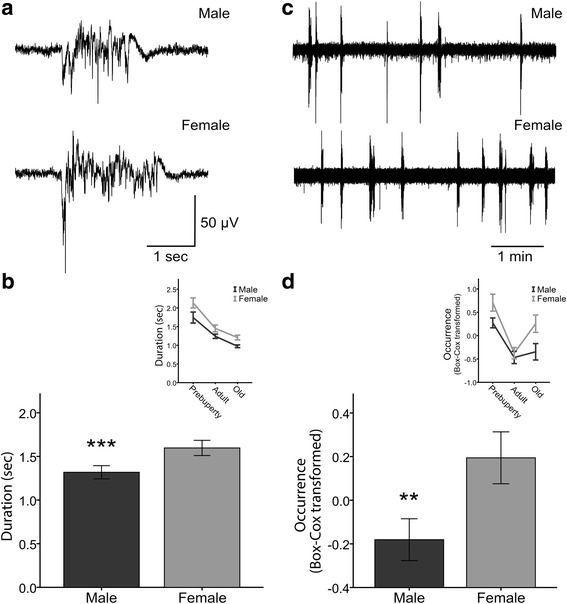
Up state activity is enhanced in female mice. LFP traces at a higher and c lower temporal resolution obtained from male (top) and female (bottom) mice. b Bar graphs for Up state duration and d occurrence (Box–Cox transformed for normality) of male (black shade) and female (gray shade) mice. Data in bars are pooled from all ages tested. Insets show line graphs of Up state duration and occurrence in pre-puberty, adult, and old ages. Graphs show mean ± SEM. Asterisks indicate significant sex differences (two-way ANOVA, ***p < 0.001 and **p < 0.01)