
Fig. 5.
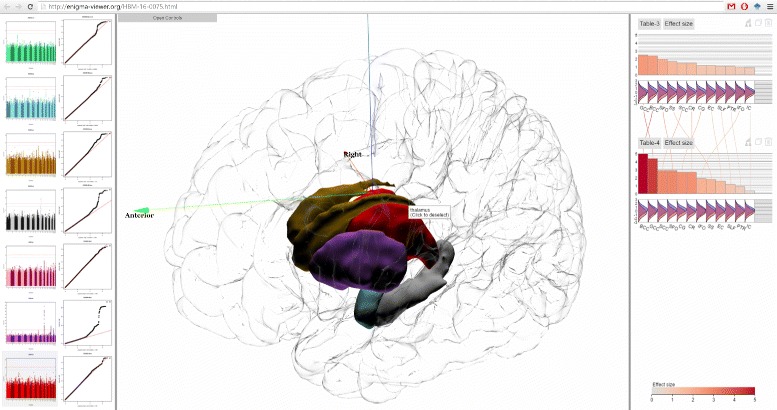
Querying Manhattan plot will highlight 3D regions. The center view displays seven sub-cortical regions and the Manhattan and QQ plots from GWAS analysis. Those regions are colored using the same colors as those in the Manhattan plots
Official websites use .gov
A
.gov website belongs to an official
government organization in the United States.
Secure .gov websites use HTTPS
A lock (
) or https:// means you've safely
connected to the .gov website. Share sensitive
information only on official, secure websites.
Querying Manhattan plot will highlight 3D regions. The center view displays seven sub-cortical regions and the Manhattan and QQ plots from GWAS analysis. Those regions are colored using the same colors as those in the Manhattan plots