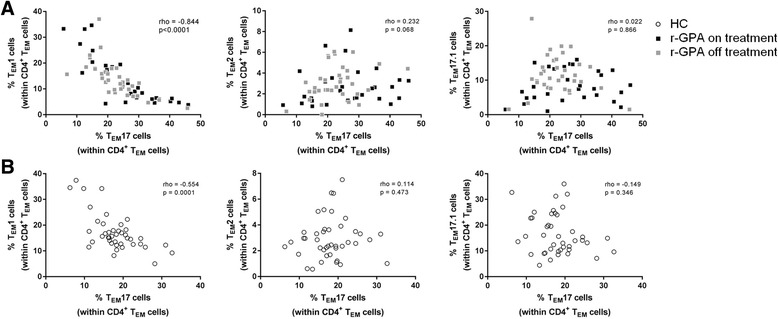
Fig. 2.

TEM17 cells negatively correlate with TEM1 cells. Correlation between the percentage of TEM17 cells and TEM1 (left), TEM2 (middle) and TEM17.1 (right) cells within the CD4+TEM cell population of a r-GPA patients (filled squares; n = 63), black squares patients on treatment (n = 29) and grey squares patients off treatment (n = 34) and b HC (open circles; n = 42). Correlations were determined by Spearman’s correlation coefficient (rho) and the level of significance is indicated by the p value. CD cluster of differentiation, HC healthy control, r-GPA GPA patient in remission, T EM effector memory T cell
