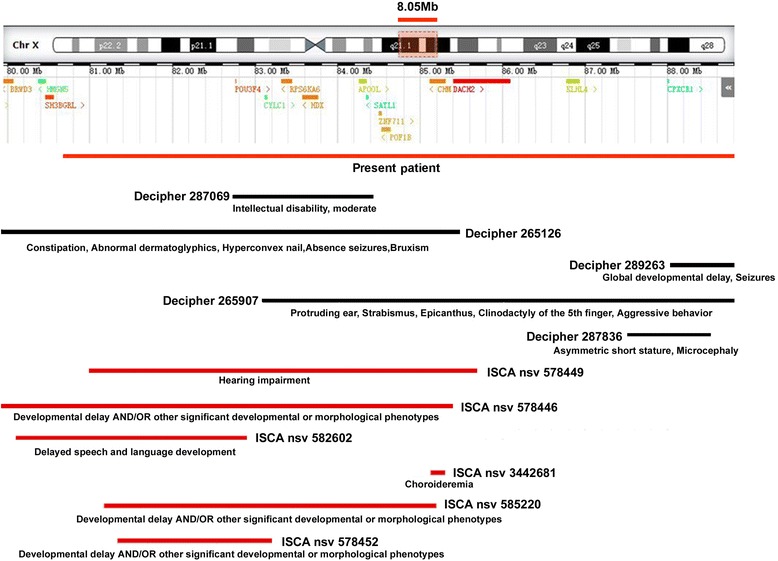
Fig. 4.

Xq21.1 deletion. The upper part of the figure illustrates the exact locations of the protein coding genes included in this region. The lower part of the figure schematically represents the Xq21.1 deleted region in our patient(in red) and other deletions reported in the Decipher(in black) and ISCA database(in red). The ID of each patient is reported. The clinical features of the patients are reported in parentheses below the corresponding deletion as described in Decipher (https://decipher.sanger.ac.uk/) and ISCA (https://www.clinicalgenome.org/)
