
Figure 2.
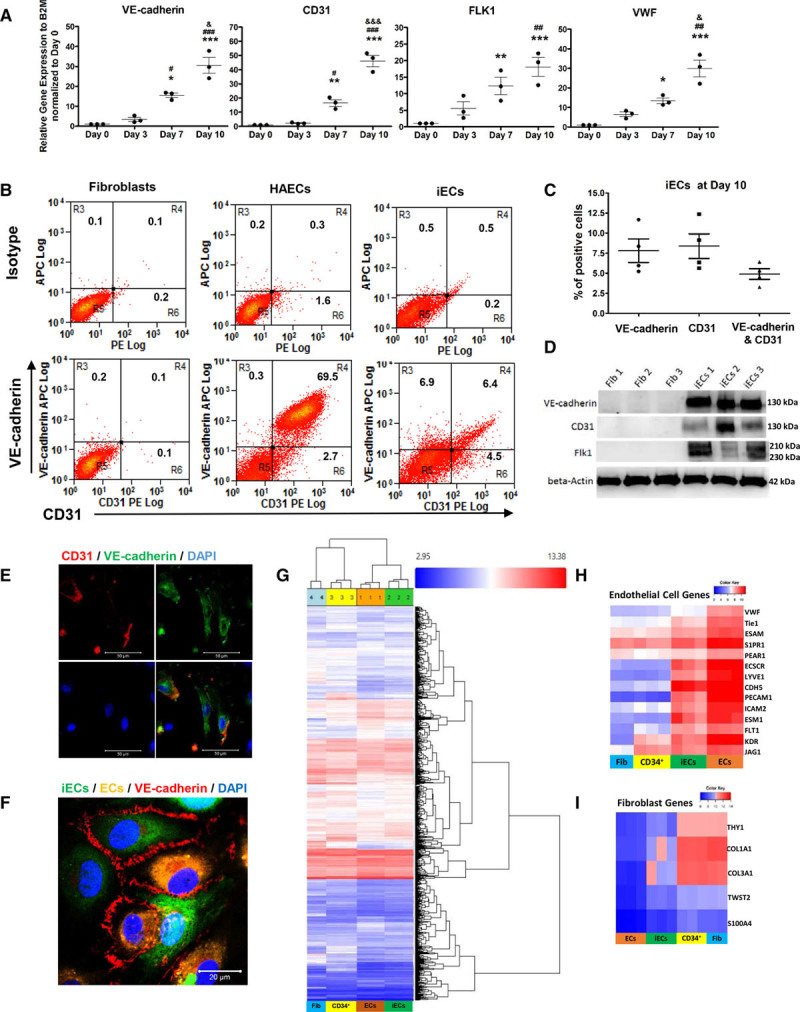
Induction of endothelial cells. A, Quantitative polymerase chain reaction (PCR) analysis of endothelial-specific genes VE-cadherin, CD31, VWF, and FLK1 in induced endothelial cells (iECs) from days 0 to 10, normalized to day 0 (n=3). B, Representative flow-cytometry plots of endothelial markers VE-cadherin and CD31 at day 10 in human aortic ECs and iECs. C, Quantification of VE-cadherin+ and CD31+ cells in iECs at day 10 from flow cytometry (n=4). D, Immunoblots of the endothelial-specific proteins human VE-cadherin, CD31, and FLK1 in iECs and fibroblasts; β-Actin served as a control. E, Representative micrographs of immunocytochemistry staining of human VE-cadherin (green) and human CD31 (red) of iECs at day 10; nuclei were stained by DAPI. Scale bars: 50 µm. F, Confocal micrographs of immunofluorescence staining of human VE-cadherin (red) in iECs (labeled by CellTracker Green, Invitrogen Catalog #: C7025TM) co-cultured with ECs (labeled by CellTracker Orange, Invitrogen Catalog #: C2927) for 2 days. Scale bars: 20 µm. G–I, Analysis of cDNA microarrays in adult fibroblasts, CD34+ progenitors (labeled as CD34+), iECs, and ECs heat map of global gene using hierarchical clustering analysis (G), heat map of endothelial genes (H), and fibroblast genes (I). The color bars indicate gene expression level in log2 scale. Blue to red color represents low to high expression level. Data are presented as mean±SE; *P<0.05, **P<0.01, ***P<0.001, compared with day 0. #P<0.05, ##P<0.01, ###P<0.001, compared with day 3; &P<0.05, &&&P<0.05 compared with day 7 using repeated measures 1-way analysis in A.