
Figure 3.
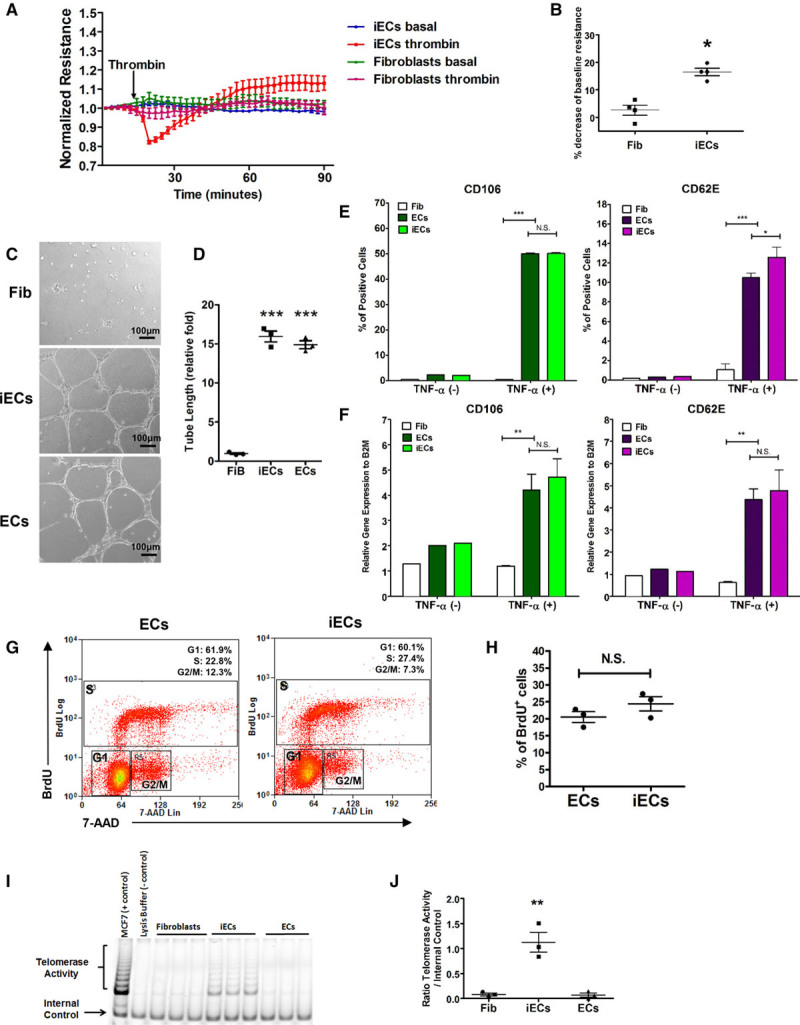
Characterization of induced endothelial cells (iECs). A and B, The permeability of iECs in response to thrombin. Transendothelial electric resistance (TER) was measured for 90 minutes in fibroblasts and iECs. Thrombin (3.5µg/mL, 0.5 U) was added as indicated. The time course of resistance in fibroblasts and iECs normalized to baseline (A) and statistical analysis (B) of percentage of deduction of resistance in response to thrombin in fibroblasts and iECs (n=4). C and D, In vitro capillary network formation of iECs and fibroblasts on Matrigel. The representative images (C) and statistical analysis (D) of tube network formation in fibroblasts, iECs, and ECs (n=3). E and F, The inflammation response of iECs. FACS analysis (E) and quantitative realtime-polymerase chain reaction (PCR) measurement (F) for CD106 and CD62E on tumor necrosis factor-α (TNF-α) activated ECs and iECs (n=3). G and H, The proliferation of iECs. Representative flow-cytometry plots (G) of the proliferation capacity of iECs and ECs as assessed by BrdU uptake and statistical analysis (H) of the percentage of BrdU+ cells in iECs and ECs (n=3). I and J, The telomerase activity of iECs. Telomerase activity was measured by a telomeric repeat amplification protocol (TRAP) assay. PCR amplification results of TRAP (I) from positive control, negative control, fibroblasts, ECs, and iECs; and statistical analysis (J) of telomerase activity in above cell types (n=3). Data are presented as mean±SE; *P<0.05, **P<0.01, ***P<0.001, N.S. P>0.05; compared with fibroblasts in B, D through F, and J; compared with ECs in E, F, and H using Student t test in B and H, 1-way analysis of variance in J and 2-way analysis in E and F.