
Figure 5.
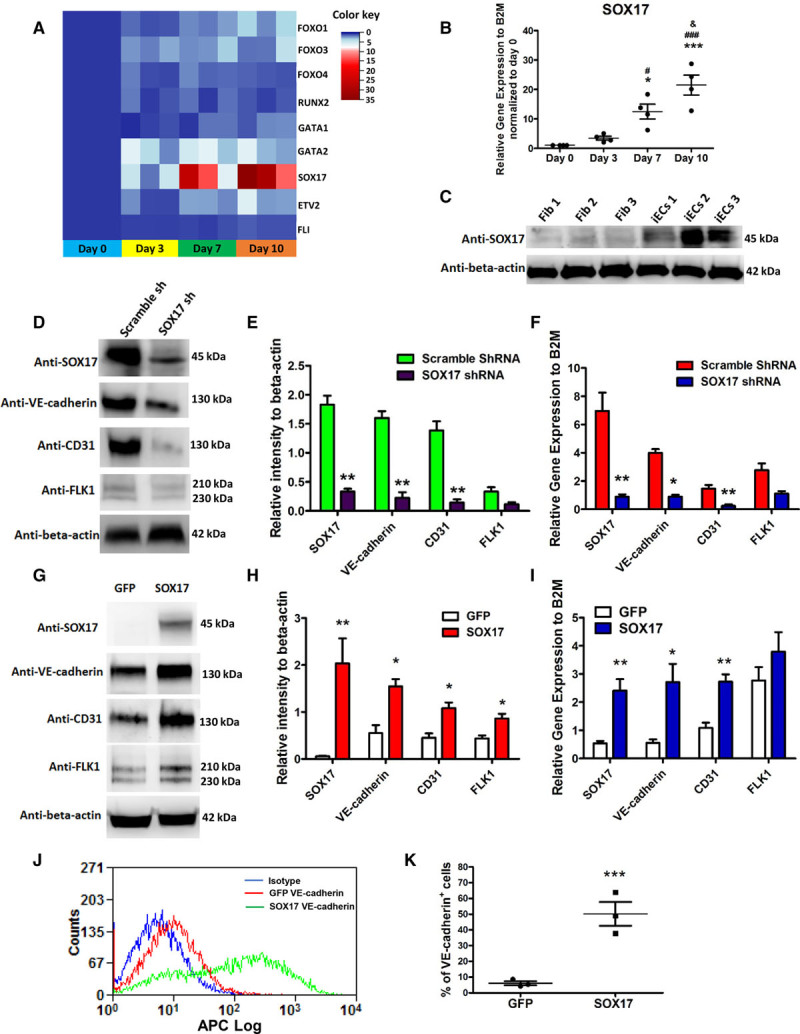
SOX17 is required for the induction of induced endothelial cells (iECs) from CD34+ progenitors. A, Heat map of endothelial developmental genes during iEC induction (iECs at days 0, 3, 7, and 10) by quantitative real-time polymerase chain reaction (PCR). The color key indicates gene expression level relative to B2M (beta-2-microglobulin) normalized to iECs at day 0. Blue to red color represents low to high expression level. B and C, The expression level of SOX17 in iECs. The time course of mRNA level of SOX17 during the induction of iECs (n=4). B, Immunoblot of SOX17 in adult fibroblasts and iECs (C). D through F, The representative immunoblots (D) and their statistical analysis (E), and the quantitative PCR analysis (F) of SOX17 and EC-specific markers VE-cadherin, CD31, and FLK1 in iECs infected with lentivirus-expressing SOX17-shRNA or scramble shRNA (n=4). G–I, The representative immunoblots (G) and their statistical analysis (H), and the quantitative PCR analysis (I) of SOX17 and EC-specific markers VE-cadherin, CD31, and FLK1 in iECs infected with retrovirus-expressing SOX17-GFP or GFP (n=4). J and K, Representative flow-cytometry overlay plots of the endothelial markers VE-cadherin (J) and statistical analysis (K) of percentage of VE-cadherin–positive cells in iECs overexpressed with SOX17-GFP or GFP. Data are presented as mean±SE; *P<0.05, ***P<0.001, compared with day 0 in A; #P<0.05, ###P<0.001, compared with day 3 in A; &P<0.05 compared with day 7 in A. *P<0.05, **P<0.01, compared with control in E, F, H, and I. Using repeated measures 1-way analysis of variance in B, the Student t test with multiple comparisons (Bonferroni Correction) in E, F, H, and I, and the Student t test in K.