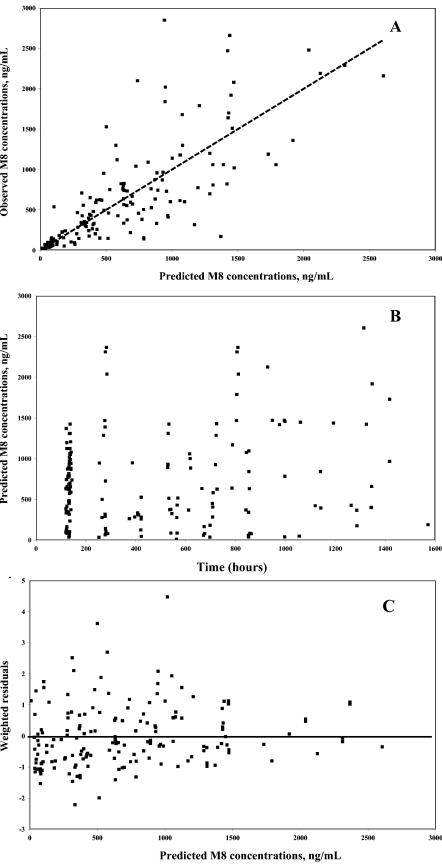
FIG. 4.
Model performance. (A) Model-predicted versus observed M8 concentrations based on population parameter estimates; (B) predicted M8 concentrations based on population parameter estimates versus time; and (C) weighted residuals versus predicted M8 concentrations based on population parameter estimates. The dotted line represents the line of identity. The solid line represents the zero abscissa line.

