. 2017 Apr 20;8(6):4533–4538. doi: 10.1039/c7sc00416h

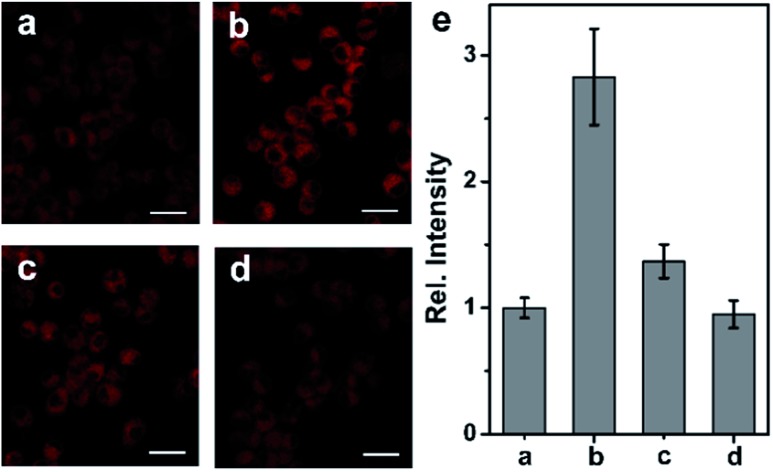
Fig. 3. (a) TP image of RAW 264.7 cells incubated with 5.0 μM NCNO for 30 min. (b) TP image of RAW 264.7 cells pretreated with NO stimulants for 16 h, and then incubated with 5.0 μM NCNO for 30 min. (c) TP image of RAW 264.7 cells pretreated with NO stimulants and 10 μM l-NNA for 16 h, and then incubated with 5.0 μM NCNO for 30 min. (d) TP image of RAW 264.7 cells pretreated with NO stimulants followed by incubation with 0.5 mM carboxyl-PTIO for 30 min, and then incubated with 5.0 μM NCNO for 30 min. (e) Relative fluorescence intensity in (a–c). The images were obtained at 600–700 nm upon the excitation at 830 nm with a femtosecond laser. Scale bars, 20 μm.

Fig. 3