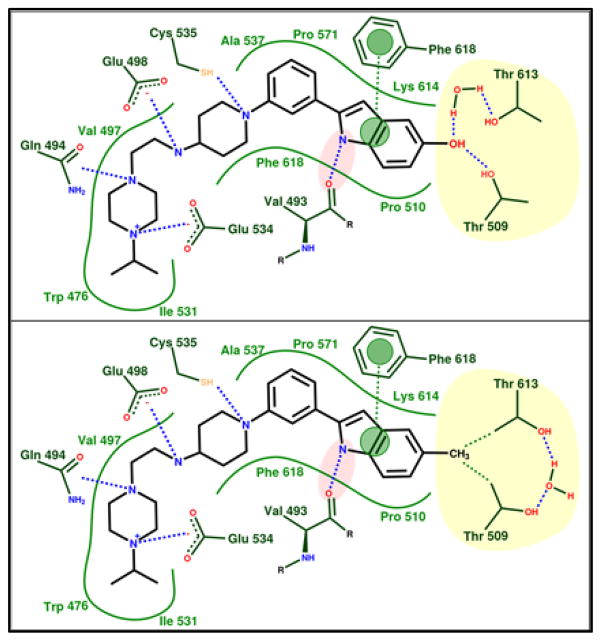
Fig. 4.
Schematic of polar (top) and apolar (or hydrophobic) (bottom) inhibitor binding modes exemplified by 5-hydroxyl analog UPCDC30256 (7, top) and 5-methyl analog UPCDC30318 (12, bottom). In both binding modes, the yellow shaded region represents the amphiphilic bis-Thr subsite. Blue dashes indicate hydrogen bonds/dipole-dipole interactions, green dashes indicate hydrophobic contacts, and green lines depict the hydrophobic and steric continuity of the binding site. Pink shading indicates a critical hydrogen bond for optimal inhibitor activity, while green circles indicate π-stacking.

