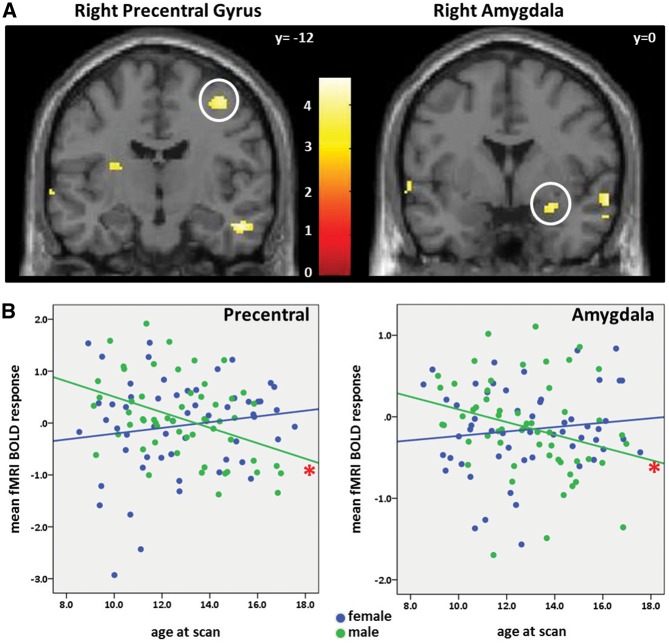
Fig. 2.
Negative vs neutral words. (A) This contrast revealed a significant group difference for linear age in the whole-brain longitudinal analysis in the right precentral gyrus at a statistical threshold of P < 0.05, FDR-corrected (top left, white circle). The amygdala was chosen as an a priori region of interest, and passed a pre-selected threshold of P < 0.001, uncorrected (top right, white circle). Color bar represents t-values and the y-coordinate is in MNI space. (B) Extracted values from the precentral gyrus and amygdala, depicted in scatterplots with mean fMRI activation on the y-axis and age at scan on the x-axis. All time points are depicted. Males (green) show a significant decrease in right precentral and right amygdala activation with age, whereas females (blue) show a persistence of activation with age. Red asterisks indicate P < 0.05.

