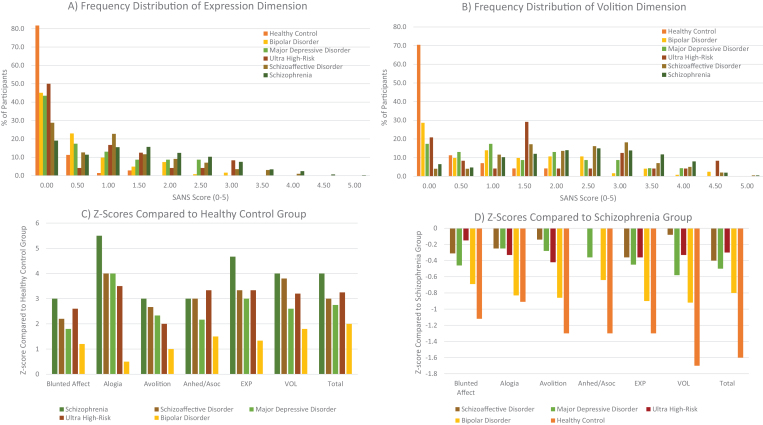
Fig. 2.
Transdiagnostic quantitative comparison of the 2 negative symptom dimensions and 5 consensus domains on the SANS. Note: Panels A and B represent frequency distributions of SANS scores on the expressive and volitional dimensions, respectively. Y-axis values reflect cumulative percentages of participants and X-axis scores denote the average SANS dimension score calculated by adding the 2 global items in each factor and dividing by 2. Exp, expression dimension; VOL, volitional dimension; Anhed/Asoc, global anhedonia/asociality item. Panels C and D reflect Z-scores for each group compared to healthy controls and schizophrenia patients, respectively. As can be seen in Panels A and B, there is variability in scores within each group, but both dimensions tend to be positively skewed. Z-scores indicated a continuum of severity scores ranging from: schizophrenia > ultra high-risk > schizoaffective >major depression > bipolar disorder > healthy control.

