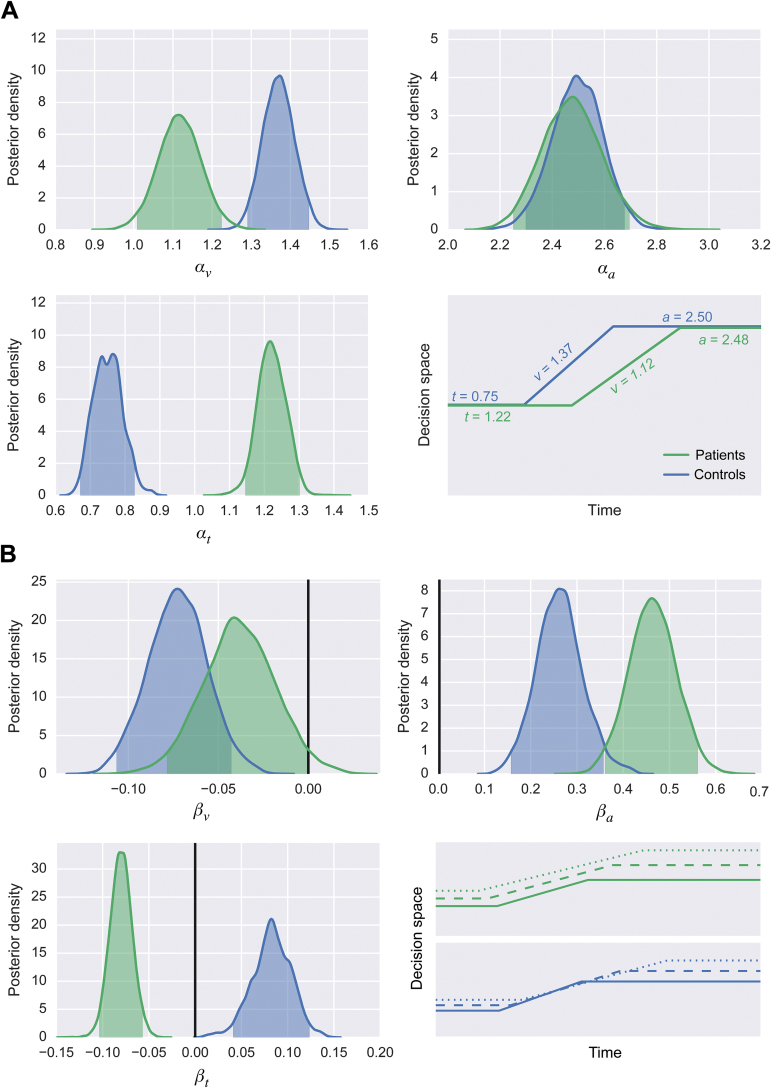
Fig. 4.
(A) Posterior densities reflecting the effects of psychosis on drift rate (top left), response caution (top right), and nondecision time (bottom left), with shaded areas representing 95% HDRs. The bottom-right schematic shows the predicted (posterior mean) values of drift rate, response caution, and nondecision time for the average 18-year-old patient and 18-year-old control. (B) Posterior densities reflecting the effects of psychosis on drift rate (top left), response caution (top right), and nondecision time (bottom left), with shaded areas representing 95% HDRs. Solid vertical lines represent a value of 0, reflecting no effect of aging. The bottom-right schematic shows the predicted (posterior mean) values of drift rate, response caution, and nondecision time for the average 20 (solid lines), 40 (dashed lines), and 60 (dotted lines) year-old patient and control.

