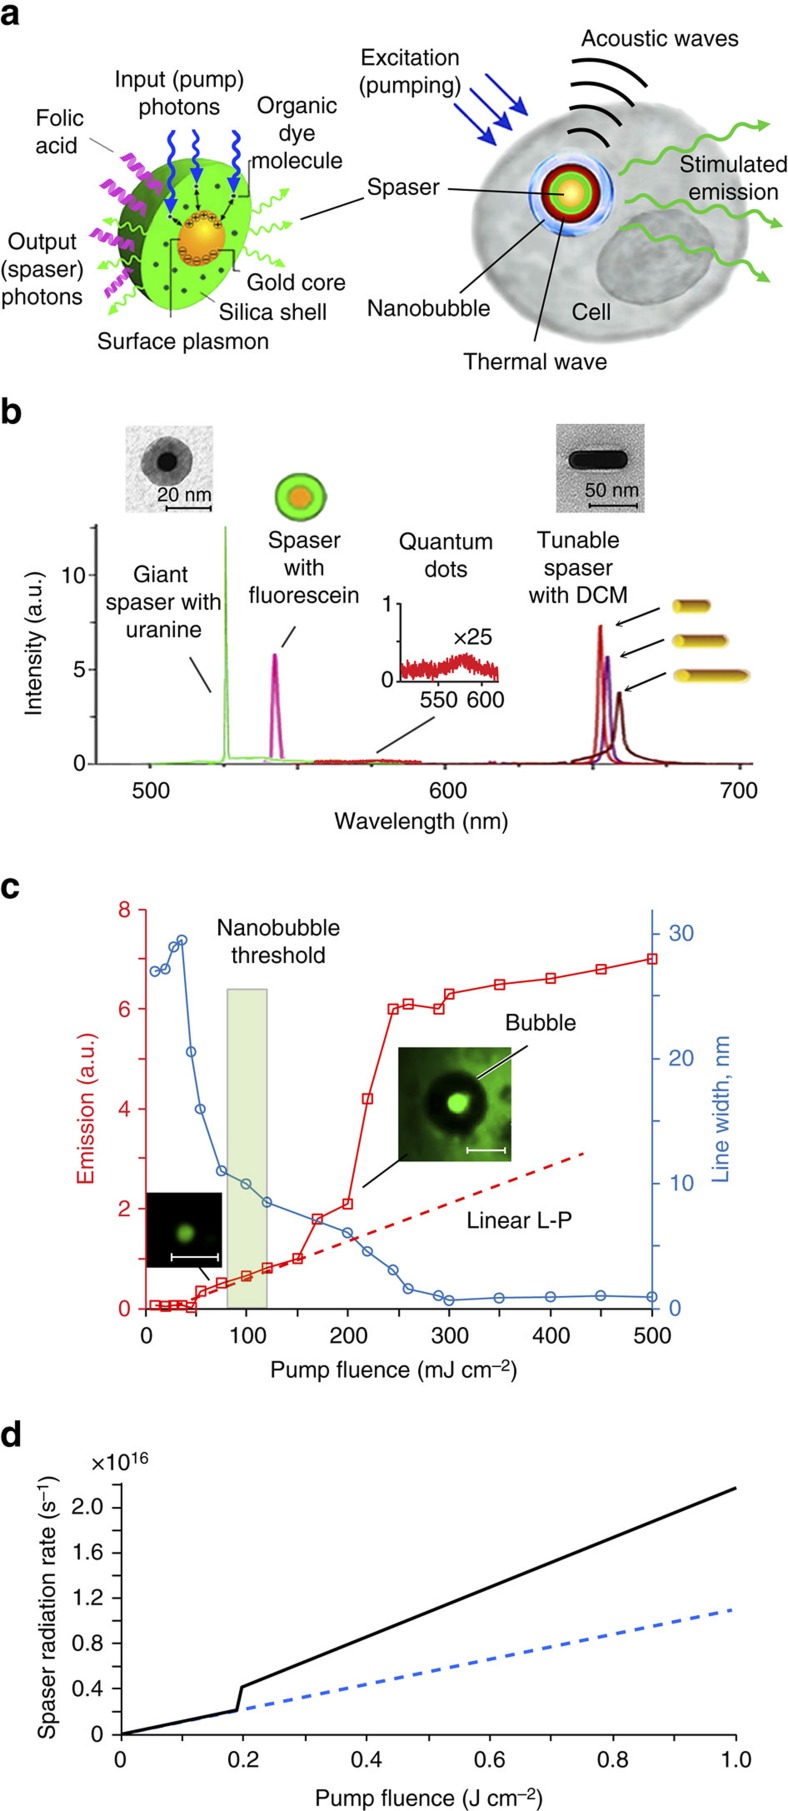
Figure 1. Study of spaser parameters.
(a) Schematic of spaser as multimodal cellular nanoprobe. (b) Comparison of emission in suspensions of uranine spaser at 528 m (green peak; pump energy fluence 70 mJ cm−2), fluorescein spaser (magenta peak), QD with maximum at 576 nm (inset, red peak) and GNRs (right) with silica shell doped with DCM. TEM images shows 22-nm spaser (left inset) and GNRs (right inset). (c) Stimulated emission in spaser suspension. Red: input–output (light out–pump in (L–P)) curve (squares) of spasing. Blue: emission linewidth of the spasing. S.d. for intensity and linewidth are in the range of 18–26%. Scale bars 1 μm. (d) Theoretical L–L curve, that is, spaser photon radiation rate Ir versus pumping fluence Jp for spaser with a bubble (a 30 nm-thick vapour shell) forming at Jp=0.2 J cm−2 (solid black curve). An L–L curve in the absence of the bubble formation is shown by a dashed blue line.

