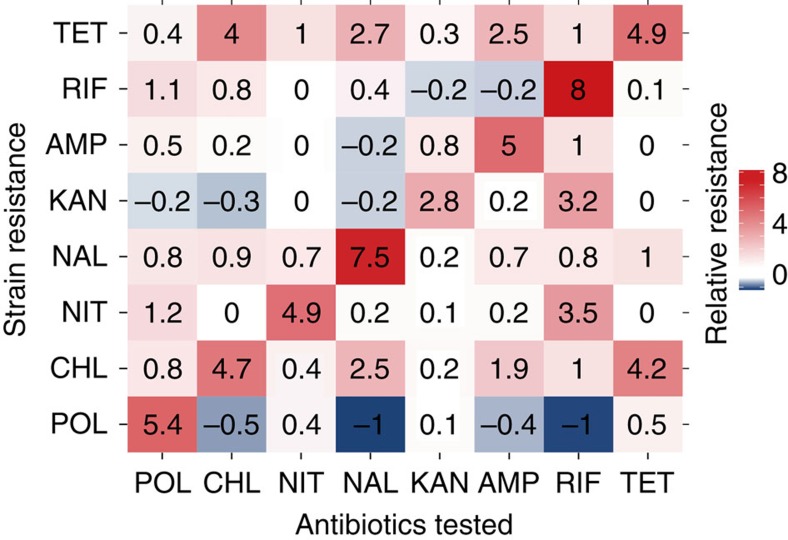
Figure 2. The collateral sensitivity and cross resistance profile of resistant strains.
MICs of the final day samples from the evolution experiments under single antibiotic conditions were tested with all eight antibiotics. Blue and red grids indicate that the antibiotic pair is collateral sensitive and cross resistance, respectively. The numbers in the grids are log2-transformed MIC fold change. The values shown in the matrix were rounded. See Supplementary Table 2 for the original data.

