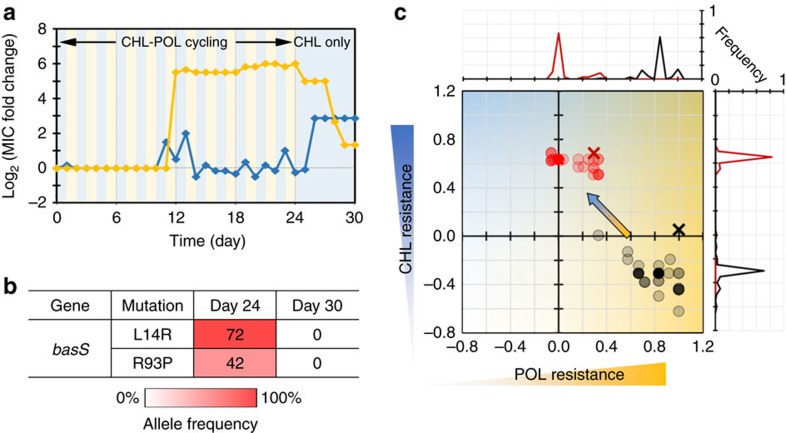
Figure 5. Reversal of evolved drug resistance with counteracting antibiotic.
(a) Evolutionary trajectories of POL and CHL resistance (yellow and blue, respectively). The background colours indicate the antibiotics used. (b) Allele frequencies of basS gene. Numbers in the map indicate the frequency of mutants in the populations, estimated from gene sequencing analysis. (c) Scatter plot of MICs of single isolates for day 24 and 30 (black and red circles, respectively). Samples sizes are n=70 for both cases. Darker colour corresponds to higher frequency. The MIC of a whole population is shown as a black or red cross, respecitvely.

