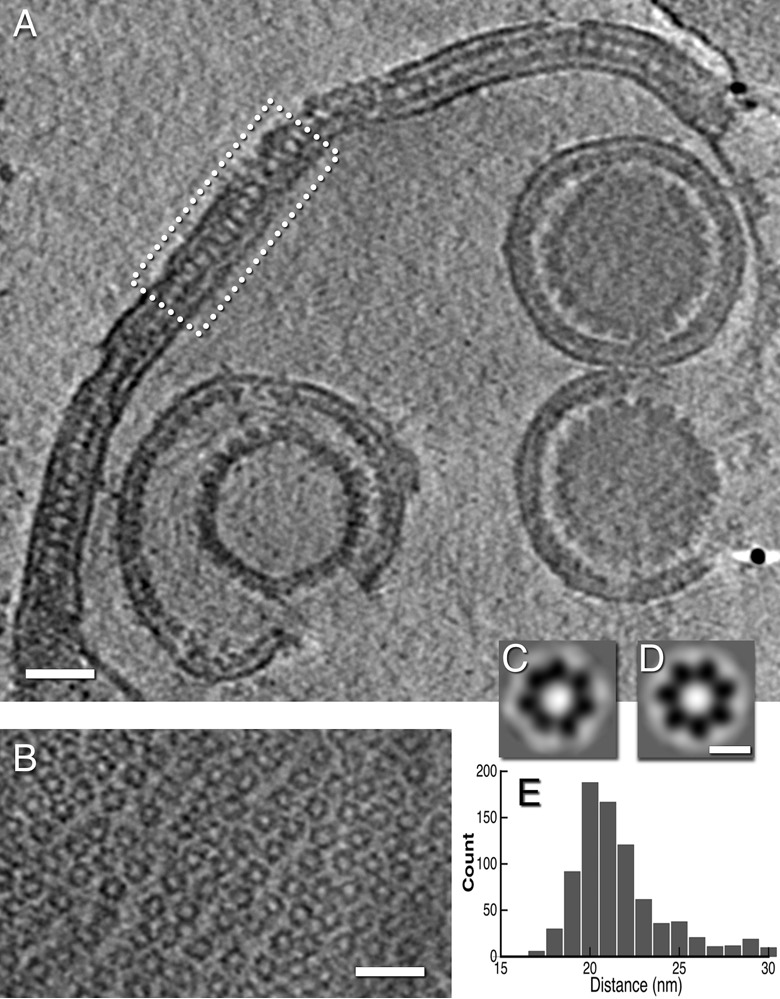
FIG 6 .

Arrays of NEC oligomers in a nuclear sac from a US3-null infection. (A) Slice through a cryo-electron tomogram of a sac. Part of the double lamella enclosing the sac is boxed. (B) A slice through part of the sac near the top of the tomogram showing a loosely ordered hexagonal array. (C and D) Averaged images of NEC rings, obtained without and with C7 symmetrization (see Materials and Methods). (E) Distribution of center-to-center spacings between neighboring rings. Scale bars = 50 nm (A and B) and 10 nm (C and D).
